Statistical Consultants Ltd |
      |
Life expectancy at birth versus GDP per capita (PPP)Graphs / Images, Econometrics / Economics 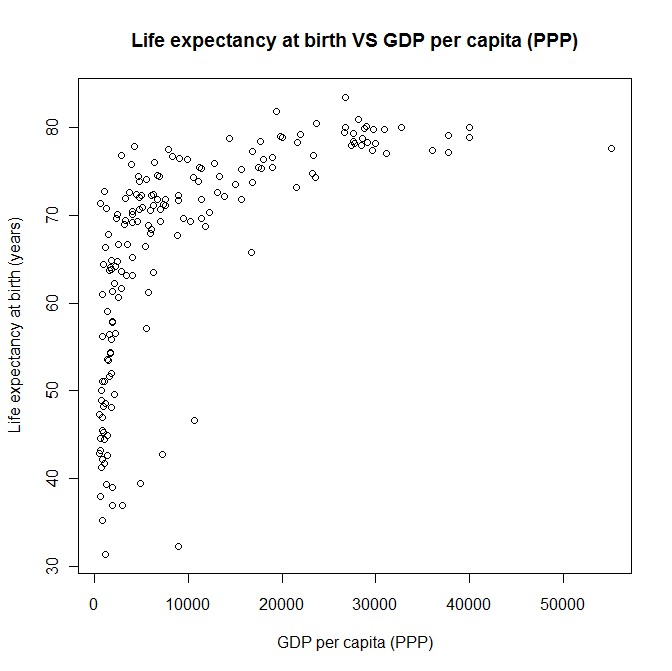 The data for this graph is available from the Index Mundi website. The data is from 2003. The graph shows that life expectancy at birth, increases at a decreasing rate with respect to The main reason for this non-linear relationship is because people consume both needs and wants. People consume needs in order to survive. Once a person’s needs are satisfied, they could then spend the rest of their money on non-necessities. If everyone’s needs are satisfied, then any increase in GDP per capita isn't the only thing that affects life expectancy. Government intervention can also affect it. A nation could be rich, but if its government ignores the plight of the poor, it could lower the life expectancy. Another reason for the wide variation in the life expectancies for countries with low The relationship between life expectancy and The following is R output for a regression model that was fitted to the data: > fit=lm(LifeExpectancyAtBirth~I(1/(GDPpcPPP+1200))+GDPpcPPP+LElt40) > summary(fit) Call: lm(formula = LifeExpectancyAtBirth ~ I(1/(GDPpcPPP + 1200)) + GDPpcPPP + LElt40) Residuals: Min 1Q Median 3Q Max -27.9828 -2.5941 0.3209 3.0735 22.6424 Coefficients: Estimate Std. Error t value Pr(>|t|) (Intercept) 7.549e+01 1.513e+00 49.884 <2e-16 *** I(1/(GDPpcPPP + 1200)) -4.827e+04 4.376e+03 -11.032 <2e-16 *** GDPpcPPP 1.401e-04 6.537e-05 2.143 0.0335 * LElt40 -2.319e+01 2.200e+00 -10.540 <2e-16 *** --- Signif. codes: 0 ‘***’ 0.001 ‘**’ 0.01 ‘*’ 0.05 ‘.’ 0.1 ‘ ’ 1 Residual standard error: 6.316 on 176 degrees of freedom Multiple R-squared: 0.7591, Adjusted R-squared: 0.7549 F-statistic: 184.8 on 3 and 176 DF, p-value: < 2.2e-16 The above output won’t make much sense to a layperson. The regression output shows that the following equation was estimated (for countries with life expectancy of at least 40) 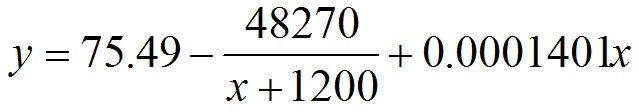 where y is the life expectancy at birth x is The regression model includes:
The estimated equation can be added to the graph: 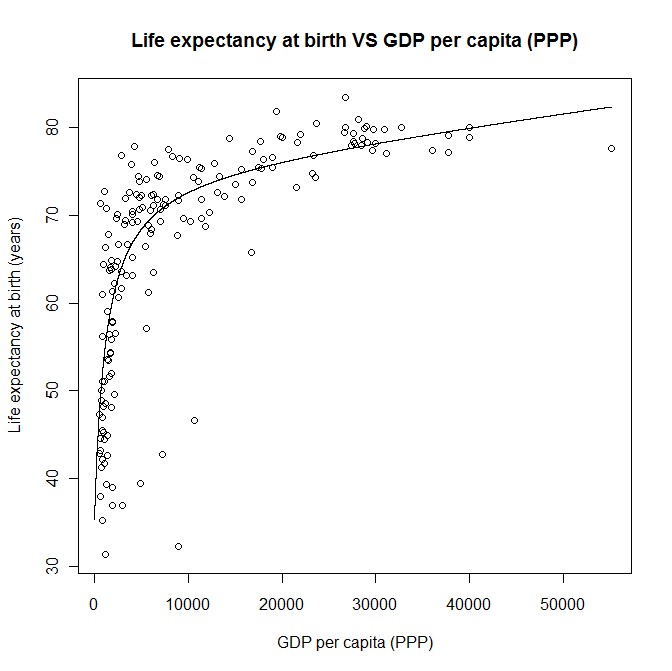 See
also:
Regression |
|
|
| Copyright © Statistical Consultants Ltd 2010 |