Statistical Consultants Ltd |
      |
Benford's Law and Accounting Fraud DetectionStatistical Analysis Techniques, Accounting, Forensics / Fraud Detection Date posted: Benford’s LawBenford’s law (also known as the first digit law or Benford’s distribution), is a distribution that the first digits of many (but not all) data sets conform to.For example, the first digit of:
Benford’s law can often be used as an indicator of fraudulent data, and can assist with auditing accounting data. Benford’s distribution is non-uniform, with smaller digits being more likely than larger digits. Benford’s Distribution Table
Benford’s Distribution Graph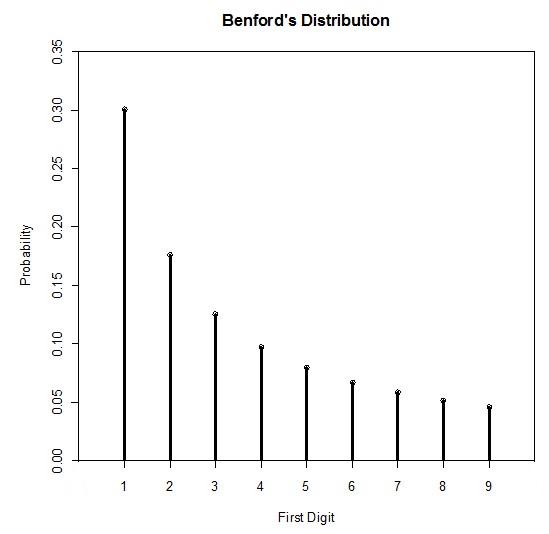 Benford’s Distribution Formula What kind of data does Benford’s law apply to?Benford’s law usually holds for data with (most of) the following characteristics:
Data that conforms to the above characteristics is very common in accounting … Accounting Fraud Detection / Accounting Forensics AnalyticsAccounts receivable, accounts payable, sales and expenses data are all based on values from two types of variables being multiplied together i.e. prices and quantities. Alone, prices and quantities are unlikely to conform to Benford’s law, but are likely to when multiplied together. Such accounting data is also likely to be right skewed. Transaction level accounting data for a large firm would almost always have a very large number of observations. If some accounting data is expected to conform to Benford’s law but doesn’t, it doesn’t necessarily mean the data is fraudulent. It would however provide a good reason for further investigation. The following are some examples of how a Benford’s distribution analysis might be performed on accounting data. Example 1:A Benford’s distribution analysis was performed on the accounts payable data for a large business. The analysis revealed an unusually large proportion of ‘ones’ among the first digits of recent figures.Upon closer inspection it was found that there were many more payout cheques slightly over $1000, than there were in the previous accounting period. Most of the previous period’s cheques were of amounts less than $100. The financial officer responsible was then questioned, and they responded by saying that they decided to aggregate amounts in an attempt to write fewer cheques. The merging of low-figure amounts is a common explanation for deviations away from Benford’s Law, making the financial officer’s explanation plausible. Upon further investigation, it was revealed that the officer was writing cheques to a bogus shell company they had created. Example 2:A Benford’s analysis was applied to an organisation’s expenses data.The initial Benford’s analysis revealed an unusually large proportion of ‘fours’ among the first digits of the data. Upon closer inspection, there were many entries for a particular expense to the amount of $45. The expense was found to be something vital for running the organisation and had to be paid frequently. That particular expense was investigated, and was then deemed legitimate. A Benford’s analysis was then applied to a copy of the expenses data but with that particular frequent expense omitted. The data which excluded that particular expense was found to conform very closely to Benford’s distribution. Generalising Benford’s Law Beyond the First DigitBenford’s analysis can be enhanced by also looking at digits beyond the first. Generalised Benford’s Distribution Table
Note that the distribution approaches uniformity, the further it goes beyond the first digit. Generalised Benford’s Distribution Formula Where n is the nth digit (n > 1). See also:Benford’s Law Explained |
||||||||||||||||||||||||||||||||||||||||||||||||||||||||||||||||||||||||||||||||||||||||||||||
|
|
| Copyright © Statistical Consultants Ltd 2011 |