Statistical Consultants Ltd |
      |
Regression
Statistical Analysis Techniques Regression involves estimating
the mathematical relationship
between one variable called the response variable (or dependent
variable), and
one or more explanatory variables (or independent variables). The explanatory variables are
used to explain the response
variable.
The response variable responds
to changes in the explanatory variables. 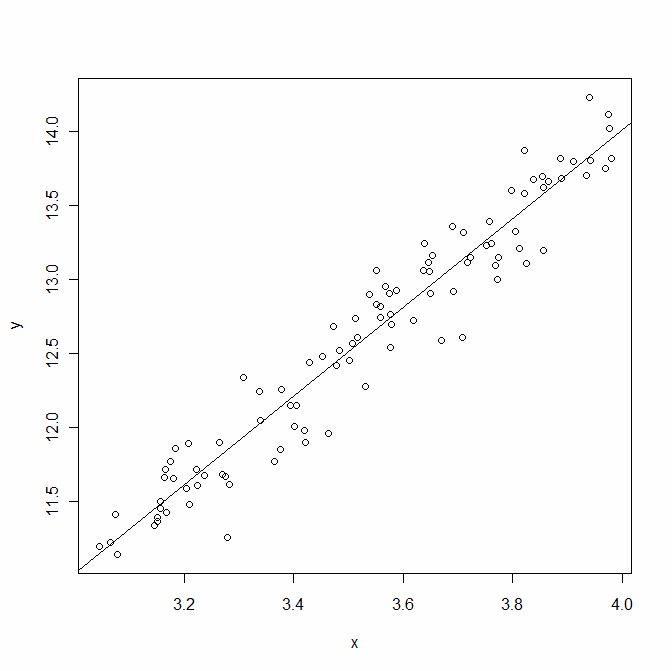
The x and y variables appear to have a linear relationship. To summarise this relationship a regression model with the structure of a straight line (intercept and slope) is fitted to the data. 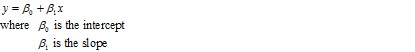
The equation of the straight line was found by finding the coefficients values that minimise the sum of squared residuals (this method is known as ordinary least squares (OLS)). 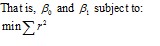
A residual is the difference between the observed response value (from the data) and estimated response value (found by plugging the observed explanatory value(s) into the model). 
After a regression model is fitted, it should then be diagnosed for faults; and if necessary, the model would be scrapped in favour of a better one. Regression modelling has two purposes: 1. To predict the response given a set of input values. 2. To estimate the effect an explanatory variable has on the response variable. |
|
|
| Copyright © Statistical Consultants Ltd 2010 |