Statistical Consultants Ltd |
      |
Operations Research ServicesOperations research (also known as management science) is an interdisciplinary subject which combines statistics, mathematics and computational techniques to solve a special class of problems which are common in business. Constrained OptimisationConstrained optimisation problems involve making a set of choices which maximise or minimise some quantity, subject to a set of constraints which must be adhered to. Applications include (but are not limited to):
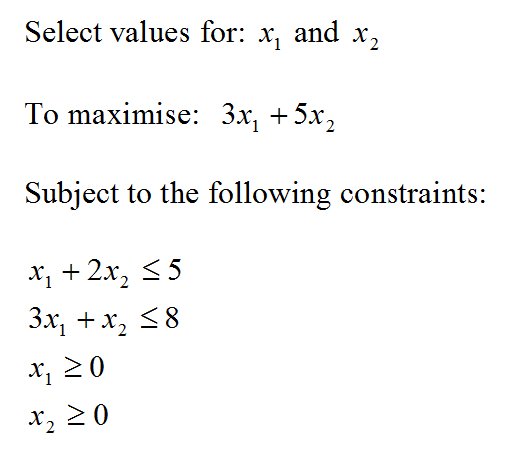
Linear ProgrammingMany constrained optimisation problems can be solved via linear programming. A linear programming problem would have all of the following features:
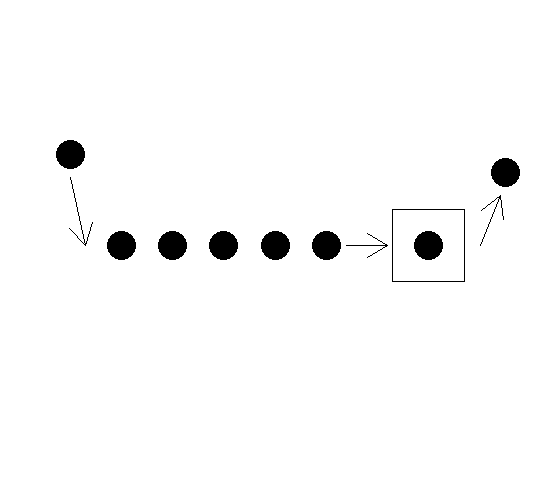
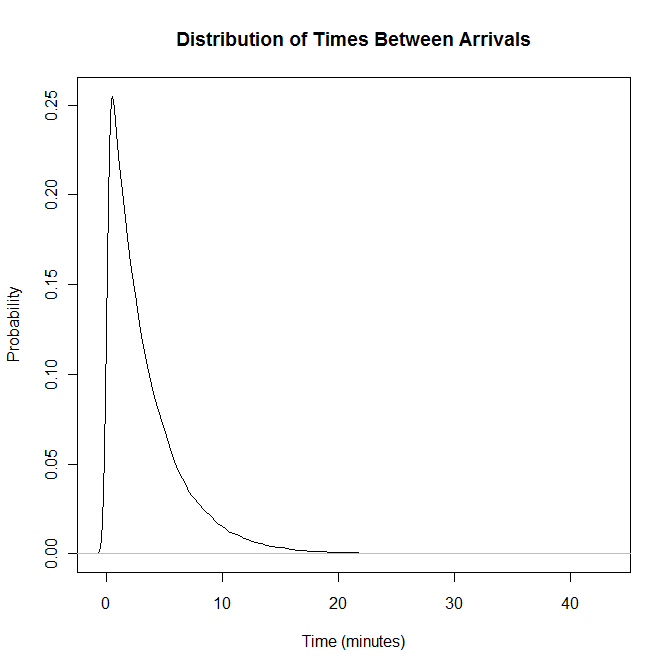
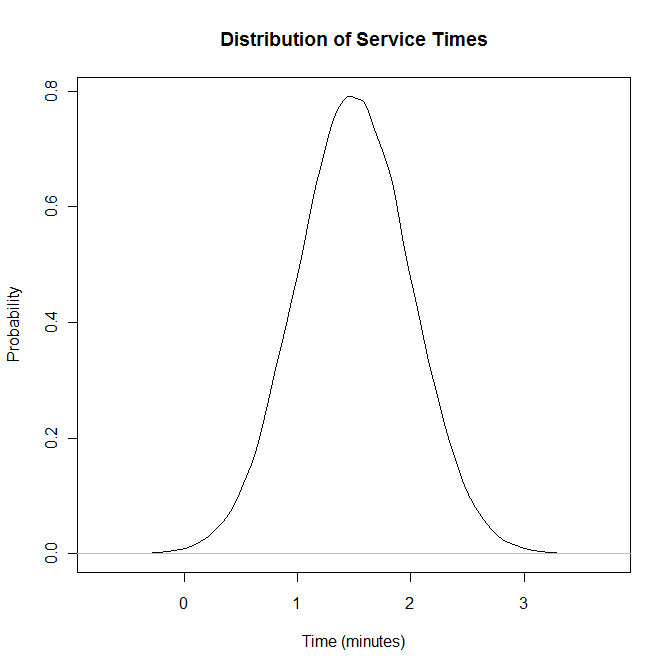
  Queue Systems Queuing processes (also known as wait-line processes) occur in a variety of situations including:
The following information can be found by modelling / simulating queue systems:
   Statistical Tools for Project Management Statistical techniques have been devised which can help managers plan, schedule, monitor and control large complex projects. These techniques include the program evaluation and review technique (PERT) and the critical path method (CPM). The statistical techniques involve estimating the time taken for each activity in the project, and then taking into account which activities are prerequisites of others. This would allow for the following information to be obtained:
Sales Forecasting for Inventory Management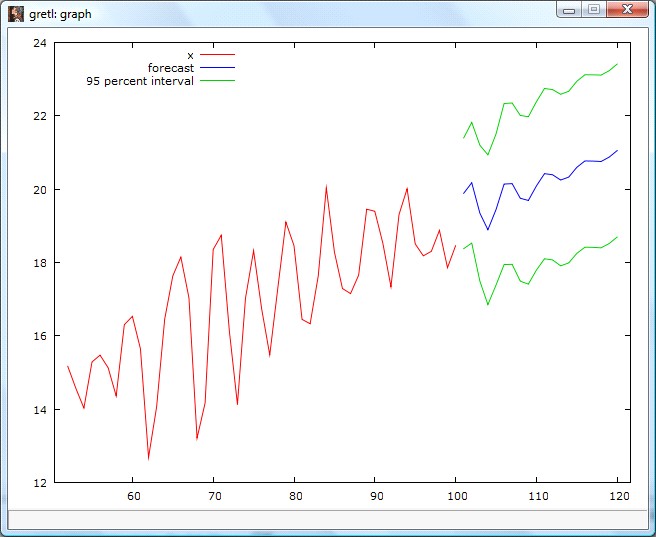 Stock shortages are bad, not just in the short term due to a lost profit opportunity, it can also detract customers in the long term. Over stocking a product can also be bad, if it means less room available for products that are in higher demand. Sales forecasts, in terms of quantity, can allow for more effective inventory management, where shortages and large surpluses are far less likely. See the Forecasting Services page for more information. Statistical Tools for Quality ControlStatistical tools such as acceptance sampling schemes and quality control charts, can be used to assist in the monitoring of product quality.During a production process, it is often a good idea to check that products are conforming to particular qualities. For example:
In most situations, quality perfection is neither practical nor possible. In such cases, a quality characteristic may follow a statistical process, where when controlled in a desirable way:
The application of statistical techniques to quality control, is known as statistical process control. These techniques include (but are not limited to) acceptance sampling schemes and quality control charts. Acceptance Sampling Schemes Acceptance sampling involves sampling a batch of products for defects, and then accepting the batch if the rate of defects is small enough, or rejecting the batch if the rate is too high. Some sampling schemes would have a range of rates deemed inconclusive, with an inconclusive sample being followed by further sampling. Control Charts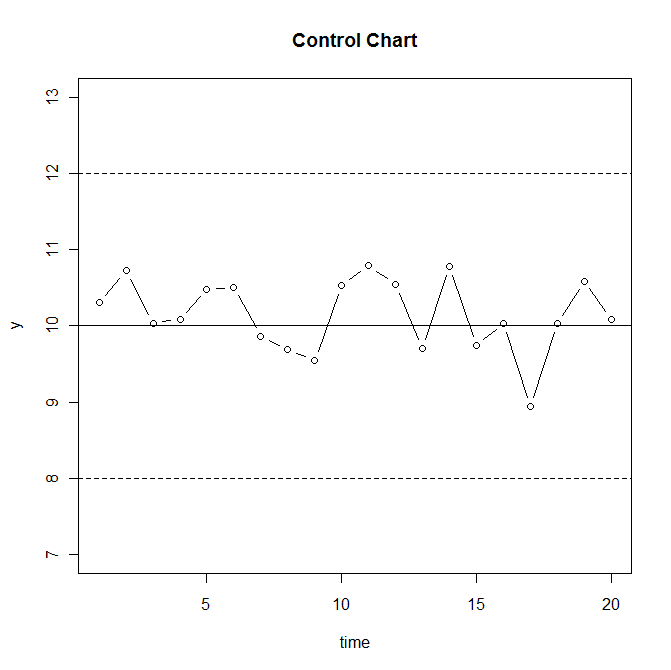 Control charts are graphs with a quantified quality characteristic on the y-axis, and time on the x-axis. The charts also have a centre line, and upper and lower control limits. The charts are used to check that a characteristic is staying between the upper and lower control limits (i.e. the desired range of values), and isn’t trending away from the centre line. |
|
|
| Copyright © Statistical Consultants Ltd 2010- |