Statistical
Programming / Data Processing Services
While working with Excel spreadsheets or text files, you may encounter
scenarios where in order to get a job done,
you need
to make many repetitive actions which could take hours, days, or even
weeks to
perform manually. Statistical
Consultants Ltd provides programming services which can greatly speed
up such
processes. Programming
is often a necessary step needed to
be taken before a statistical analysis can be performed. Customised
programs written
by Statistical Consultants Ltd would be run for the client
and/or
given
to the
client to run (along with a set of easy to follow instructions).
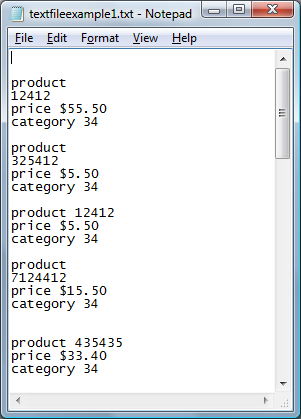
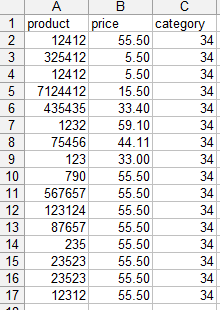
Data Extraction Example - Extracting
data from an untidy text file
Information in an untidy text file needs
to be stored
into a spreadsheet. For
example:
|
→
|
 |
One
option would be to copy and paste the information
manually. Although
this would be a good
idea for small amounts of data, it would be very time consuming if
there were
thousands of entries.
In situations where there is a lot of data to be processed,
a far quicker alternative would be to have a customised program written
which reads
that information, processes it into a tidy data set, and then saves
that data
set as a spreadsheet.
If there are inconsistencies in the text file (like
the alignment
of the product numbers in the above example), it may still be possible
for a
program to be written. In
such a case,
it would just be a matter of expanding the program to cater for those
inconsistencies.
Automated Statistical
Processes
In a consulting project which involves a
statistical analysis
(e.g. data
analysis, statistical
modelling, forecasting,
data-mining
etc), it may be possible
for a program to be written which instantly repeats the same analysis
to an
updated data set.
For example, a program could be written which takes the
following steps:
- The data is processed so that it can be read by and
analysed
using statistical software. This
could
involve reformatting/editing values, imputing missing values or
deriving new
data.
- A statistical model would be fitted to the data.
- The model would be diagnosed to see if it is still
suitable.
- The model would then be used to generate predictions,
estimations, graphs and/or other information.
|


